
 English
 Español
 عربى
عربىCat:UF Membrane
In the field of industrial water purification, strict quality standards are required. In response to this challenge, a membrane filter with a PVDF str...
See DetailsService hotline: +86-13396595772


When evaluating water treatment solutions, businesses often face a critical question: how much will a ro pure water systems actually cost over its operational lifetime? Unlike initial purchase prices, the true financial picture emerges only when analyzing installation, maintenance, energy consumption, and replacement parts across 5 to 15 years of operation. This comprehensive assessment reveals why many enterprises are switching from conventional methods to advanced reverse osmosis water system technology.
The financial viability of reverse osmosis water purification extends beyond simple arithmetic. Organizations must account for water quality improvements, regulatory compliance benefits, and reduced waste management expenses. Industrial facilities utilizing industrial RO water system solutions often discover that initial skepticism about costs transforms into recognition of substantial long-term savings.
The starting point for any cost-effectiveness analysis requires honest assessment of upfront expenses. A typical commercial RO water purification equipment installation ranges considerably based on production capacity and facility requirements.
Commercial-grade installations generally require between 8,000 to 50,000 currency units, depending on daily water production requirements. Smaller office installations might cost less, while large-scale industrial operations demand significantly higher investments. These figures encompass the reverse osmosis membrane system, filtration components, holding tanks, and professional installation labor.
Most installations necessitate site preparation work including plumbing modifications, electrical upgrades, and drainage system adjustments. These ancillary costs typically add 20 to 30 percent to the base equipment price. Facilities with existing water treatment infrastructure may reduce this percentage, while those requiring substantial renovations might see higher expenses.
Unique facility requirements often demand specialized configurations. High-salinity water sources require additional pretreatment stages. Operations in regions with strict discharge regulations need advanced reject water management systems. These customizations range from minimal to substantial, directly affecting total initial investment.
Energy represents the largest recurring operational expense for reverse osmosis systems. The process requires sustained pressure to force water through semipermeable membranes, consuming 0.5 to 3 kilowatt-hours per 1,000 gallons depending on feed water characteristics and system efficiency. In regions with higher electricity rates, energy costs can represent 40 to 60 percent of total operational expenses.
Modern RO water treatment systems incorporate energy recovery devices that capture pressure from reject water, reducing energy consumption by 20 to 40 percent. While these additions increase initial costs, they generate measurable returns within 3 to 5 years through reduced utility bills.
RO filtration system membranes require replacement every 3 to 5 years depending on water quality, operating hours, and maintenance practices. Replacement costs typically range from 2,000 to 8,000 currency units per membrane system, with larger operations requiring multiple units. Regular maintenance between replacements, including sanitization and inspection, adds another 500 to 1,500 currency units annually.
Pretreatment chemicals prevent fouling and scaling that degrade membrane performance. Typical chemical costs run 200 to 600 currency units monthly depending on feed water contamination levels. Some facilities experience higher chemical expenses if source water contains high mineral content or organic matter.
Professional system operation and monitoring requires skilled personnel. Many facilities allocate 0.25 to 0.5 full-time equivalent positions to system management. Training, wages, and ongoing technical support typically cost 15,000 to 40,000 currency units annually depending on facility size and geographic location.
Understanding relative costs requires comparison with conventional water treatment approaches. Organizations typically evaluate RO pure water system costs against bottled water procurement, municipal water treatment, or ion exchange systems.
| Cost Factor | RO System | Bottled Water | Ion Exchange |
|---|---|---|---|
| Initial Investment | 15,000-45,000 | 2,000-5,000 | 8,000-30,000 |
| Annual Operating Cost (1M gallons) | 8,000-15,000 | 35,000-50,000 | 12,000-20,000 |
| 5-Year Total Cost | 55,000-120,000 | 177,000-255,000 | 60,000-130,000 |
| Per-Gallon Cost (10-year avg) | 0.08-0.12 | 0.35-0.50 | 0.10-0.18 |
This comparison demonstrates that while initial RO investment exceeds certain alternatives, long-term per-unit costs prove significantly more favorable. Facilities consuming substantial water volumes achieve cost parity within 3 to 4 years and realize substantial savings thereafter.
Return on investment depends critically on baseline water usage and current procurement methods. Organizations switching from bottled water delivery typically achieve payback within 18 to 36 months. Those replacing aging ion exchange systems recover investment between 24 and 48 months. Industrial facilities with high daily consumption often realize payback within 12 to 24 months.
Beyond payback periods, organizations must evaluate net present value across system lifespan. A water desalination system operating for 12 years generates different financial profiles than one expected to run 15 or 20 years depending on technology advances and facility expansion plans.
Standard ROI calculations often omit indirect financial advantages. Reduced product quality issues from improved water purity, decreased equipment corrosion in downstream processes, lower maintenance requirements for connected equipment, and avoided regulatory penalties for water quality non-compliance all contribute to actual financial performance exceeding calculated figures by 10 to 20 percent.
Feed water characteristics dramatically impact operational expenses. Low-salinity surface water sources require minimal pretreatment, resulting in lower chemical and maintenance costs. High-salinity groundwater or seawater desalination demands additional treatment stages, increasing both capital and operational expenses. Organizations should conduct detailed water quality analysis before cost projections, as this single factor can create 30 to 50 percent variance in operational expenses.
Geographic location affects multiple cost components. Regions with high electricity rates experience elevated energy expenses for pump operation. Areas with extreme temperatures may require additional heating or cooling systems for optimal membrane performance. Seasonal variation in water quality influences chemical consumption patterns throughout the year. Facilities in remote locations face higher maintenance labor costs and extended equipment delivery times.
System capacity directly correlates with equipment costs and economies of scale. Oversizing systems increases capital expenditure without proportional benefit. Undersizing creates operational strain, accelerates component wear, and reduces overall efficiency. Accurate demand forecasting combined with 15 to 20 percent capacity buffer ensures optimal economic performance.
Evolving water quality standards, discharge regulations, and wastewater treatment requirements affect both initial system design and operational procedures. Organizations anticipating stricter regulations justify investment in more advanced systems with greater flexibility. Similarly, locations with stringent discharge standards may require expensive reject water treatment, increasing operational costs but justifying premium water treatment investments.
Rigorous preventive maintenance extends membrane lifespan from 3 years to 5 years or more, reducing replacement frequency and associated costs. Facilities implementing comprehensive monitoring programs identify degradation early, preventing catastrophic failures that require emergency replacement and emergency service expenses. Training quality directly influences operational efficiency and component longevity.
Advanced system designs incorporate pressure exchanger technology, high-efficiency pumps, and variable frequency drives that reduce energy consumption by 20 to 40 percent compared to conventional designs. While initial costs increase, energy savings typically exceed additional equipment expenses within 3 to 5 years. Solar or wind power integration further reduces operational expenses in suitable geographic locations.
Selecting appropriate membrane types for specific application requirements extends service life and reduces replacement frequency. High-rejection membranes perform optimally with challenging feed waters but may overperform when unnecessary. Standard-performance membranes prove more cost-effective for lower-salinity applications. Professional membrane selection analysis pays dividends across extended operating periods.
Strategic pretreatment system design removes problematic contaminants before they reach expensive RO elements. Sand filtration, activated carbon treatment, and ultrafiltration stages protect membranes from fouling and scaling. While pretreatment adds initial and operational costs, it prevents expensive membrane damage and replacement, generating net cost reductions over system lifetime.
Reverse osmosis systems produce concentrated reject water containing removed minerals and contaminants. Instead of costly disposal, forward-thinking facilities find productive uses for reject streams. Non-potable applications in landscaping, cleaning, or industrial processes reduce waste management expenses and utilize produced water effectively. Some facilities sell reject water to agricultural or industrial users, generating revenue that offset operational expenses.
Organizations requiring multiple water treatment systems benefit from economies of scale. Bulk equipment purchases, unified chemical procurement, and consolidated maintenance contracts reduce per-unit costs by 15 to 30 percent. Centralized system management platforms reduce monitoring and control expenses for geographically distributed installations.
Evaluating true cost-effectiveness requires extending analysis across complete system lifespan. A 10-year lifecycle includes multiple membrane replacements, equipment component failures and repairs, inflation-adjusted energy and chemical costs, and potential technology upgrades.
Initial years (Years 1-2) show highest annual costs due to equipment investment amortization combined with operational expenses. Years 3-4 typically represent minimum annual costs as initial investment is absorbed and before first membrane replacement becomes necessary. Years 5 onwards include additional membrane replacement cycles, increased maintenance as components age, and inflation-adjusted operational expenses.
Money's time value means future expenses count less than immediate outlays. Organizations discounting future costs at 5 to 8 percent annually find that systems with lower early-year expenses but higher later-year costs often prove superior to opposite scenarios. Conversely, facilities with capital constraints may prioritize lower initial investment despite higher total lifetime costs.
Even well-designed systems experience unexpected problems. Catastrophic membrane failure, pump bearing degradation, or control system malfunction can occur outside normal maintenance cycles. Organizations should budget 10 to 15 percent contingency allowance for emergency repairs and component replacement. Service contracts that include emergency response often prove cost-effective despite upfront expenses.
Source water characteristics change seasonally or long-term. Increased contamination from industrial development, agricultural runoff changes, or infrastructure deterioration elevates pretreatment chemical requirements and accelerates membrane fouling. Systems designed with capacity reserve and flexible pretreatment configurations adapt to water quality changes without requiring costly redesign or capacity expansion.
Water treatment technology continuously improves. Systems installed today may become inefficient within 10 to 15 years as superior membranes, more efficient pumps, and advanced monitoring systems become available. Forward-looking organizations select modular system designs permitting component upgrades without complete replacement, limiting technology obsolescence financial impact.
Environmental regulations, water quality standards, and discharge requirements evolve. Systems meeting current regulations may require modification or expensive upgrades to comply with new requirements. Selecting systems with inherent flexibility and substantial performance margins reduces future regulatory compliance costs.
These sectors require exceptionally pure water meeting stringent quality specifications. While raw RO system costs remain comparable to other industries, additional polishing stages using ultrafiltration and ion exchange increase total investment. However, high-purity water requirements make RO systems mandatory regardless of cost. Pharmaceutical facilities typically achieve cost justification through reduced product loss, minimized batch rejection, and compliance with regulatory purity standards. Quality improvements often justify system costs within 12 to 24 months through reduced manufacturing failures.
This industry balances strict quality requirements with cost sensitivity. Beverage producers find water treatment costs directly impact production costs and product quality, justifying investment in advanced reverse osmosis systems. Food processing facilities use treated water in cleaning, cooling, and production processes. Cost-effectiveness emerges when considering equipment corrosion reduction, improved product consistency, and extended equipment lifespan offsetting water treatment investment.
Heavy manufacturers use water in cooling loops, boiler feed, and process applications. Untreated water causes scale buildup, equipment corrosion, and operational inefficiency. Sophisticated water desalination systems prevent these problems. Financial analysis must include avoided costs from scale removal, cooling system maintenance, boiler repair, and equipment replacement. Many industrial facilities discover that water treatment costs pale compared to avoided equipment damage and lost production.
Hotels, resorts, and large office complexes benefit from on-site water treatment for guest consumption, HVAC systems, and cleaning applications. While per-gallon costs exceed municipal water pricing initially, improved guest satisfaction from quality drinking water, brand differentiation, and operational cost reduction through scale prevention often justify investment for premium-focused facilities.
Accurate assessment requires detailed baseline information. Document current water consumption across all facility processes. Test feed water quality for salinity, hardness, organic content, and contamination levels. Identify current water procurement costs including municipal charges, bottled water expenses, or existing treatment system operational costs. Research local electricity rates, chemical costs, and skilled labor expenses. Determine applicable environmental regulations and discharge restrictions.
Request detailed cost proposals from multiple qualified vendors. Ensure proposals include installed system cost, estimated annual operational expenses with itemized breakdowns, warranty terms and optional service contracts, membrane replacement schedules and costs, and expected system lifespan under specified operating conditions. Evaluate vendor experience with similar applications, financial stability indicating long-term support availability, and quality of technical support services.
Develop spreadsheet models comparing total cost scenarios including different water consumption levels, varying energy cost assumptions, alternative membrane replacement frequencies, and different operational lifespans. Sensitivity analysis reveals which variables most strongly influence financial outcomes. Examine how modest changes in electricity costs, water consumption, or maintenance frequencies impact overall cost-effectiveness. This process identifies most critical cost drivers and assists in contingency planning.
Quantify benefits beyond direct cost reduction. Improved product quality may increase customer retention and revenue. Enhanced employee satisfaction from better facility water may improve retention and productivity. Brand reputation improvements from sustainable water management practices attract environmentally conscious customers and partners. Regulatory compliance certainty provides peace of mind and eliminates violation risk. While harder to quantify, these benefits often prove decisive in financial justification.
Comprehensive analysis demonstrates that RO pure water systems prove cost-effective investments for most organizations with meaningful water consumption and quality requirements. While initial capital costs may seem substantial, operational expenses per unit of water produced consistently underperform alternative approaches when evaluated across complete system lifespans.
Organizations transitioning from bottled water procurement typically achieve financial payback within 2 to 3 years and accumulate six-figure savings across 10-year system operation. Those replacing aging water treatment infrastructure often recover investment within 3 to 4 years. Large industrial operations with high daily water consumption realize payback within 12 to 24 months and generate substantial ongoing savings.
Beyond mathematical cost analysis, RO water purification systems deliver intangible but significant value through improved water quality, operational reliability, environmental responsibility, and regulatory compliance certainty. These qualitative benefits often prove decisive in strategic investment decisions.
The path to cost-effectiveness requires thoughtful system selection matched to specific facility requirements, diligent operational practices emphasizing preventive maintenance, and strategic management of operational expenses. Organizations investing time in thorough evaluation, selecting appropriate technology, and maintaining systems properly consistently realize financial returns exceeding initial expectations. For water-intensive facilities, advanced water treatment represents not an optional luxury but a financially prudent operational investment with tangible returns spanning decades.
Payback periods vary depending on current water procurement methods and consumption levels. Organizations switching from bottled water delivery typically recover investment within 18 to 36 months. Those replacing existing municipal water charges may see payback within 36 to 48 months. Industrial facilities with very high consumption sometimes achieve payback within 12 months. Detailed financial modeling with facility-specific parameters provides accurate payback projections.
Membrane replacement costs range from 2,000 to 8,000 currency units depending on system size and membrane quality. Replacement intervals typically span 3 to 5 years under normal operating conditions. Facilities with exceptional feed water quality may extend intervals to 5 to 7 years. Those operating under challenging conditions may require replacement every 2 to 3 years. Preventive maintenance significantly extends membrane lifespan and reduces replacement frequency.
Energy consumption typically accounts for 40 to 60 percent of total operational expenses. Electricity powers the high-pressure pumps forcing water through reverse osmosis membranes. Variable frequency drives, energy recovery systems, and improved pump technologies reduce energy requirements by 20 to 40 percent. Chemical costs for pretreatment and system maintenance represent the second-largest expense category. These two categories generally comprise 80 to 90 percent of annual operational costs.
Yes, many facilities productively utilize reject water. Non-potable applications including landscape irrigation, facility cleaning, vehicle washing, and cooling tower makeup water eliminate disposal costs and reduce overall water waste. Some facilities sell reject water to agricultural operations or industrial users, generating revenue offsetting operational expenses. Reject water quality suitability depends on facility requirements and regulatory approval for intended applications.
RO systems typically generate significant savings compared to bottled water. Bottled water commonly costs 35 to 50 cents per gallon when accounting for delivery, storage, and bottle handling. RO system per-gallon costs average 8 to 12 cents over 10-year system lifespans. Organizations consuming 10,000 gallons monthly save 2,760 to 5,040 currency units annually compared to bottled water. Larger consumption volumes amplify savings proportionally.
Salinity and mineral content most directly influence costs. High-salinity water requires more robust membranes and additional treatment stages, increasing both initial and operational expenses. Organic contamination necessitates additional pretreatment with activated carbon or ultrafiltration, further increasing costs. Hard water with high calcium and magnesium levels requires chemical pretreatment to prevent scaling. Facilities with challenging feed water characteristics should expect 30 to 50 percent higher costs compared to low-salinity sources.
Many jurisdictions offer tax credits, rebates, or grants for water conservation and efficiency improvements. Eligibility and program specifics vary significantly by location, facility type, and system characteristics. Organizations should research local environmental agencies, utility companies, and government resources for available incentive programs. Professional consultants specializing in water treatment often possess current knowledge of available financial incentives that can meaningfully reduce net system costs.
Larger systems benefit from economies of scale, reducing per-unit costs. Small office installations producing 5,000 gallons daily may experience per-gallon costs of 0.15 to 0.20 currency units. Medium facilities producing 50,000 gallons daily often achieve 0.08 to 0.12 currency units per gallon. Large industrial installations producing 500,000 or more gallons daily may reduce costs to 0.05 to 0.08 currency units per gallon. This cost progression reflects both lower relative operational expenses and higher equipment utilization for larger systems.
Preventive maintenance programs focusing on regular membrane cleaning, equipment inspection, and early problem identification extend component lifespan and prevent catastrophic failures. Facilities implementing monthly system inspections, quarterly chemical testing, and annual professional servicing typically extend membrane life by 30 to 50 percent and avoid emergency repair expenses. Proper operator training ensuring correct system operation procedures represents perhaps the single most cost-effective maintenance investment.
Energy recovery devices capture pressure energy from the reject water stream, reducing pump energy requirements by 20 to 40 percent. While adding 5,000 to 15,000 currency units to initial system cost, these devices typically repay their additional expense within 3 to 5 years through reduced electricity consumption. Long-term savings accumulate to 80,000 to 200,000 currency units across complete system lifespan depending on system size and operating hours, making energy recovery a financially prudent investment for most applications.
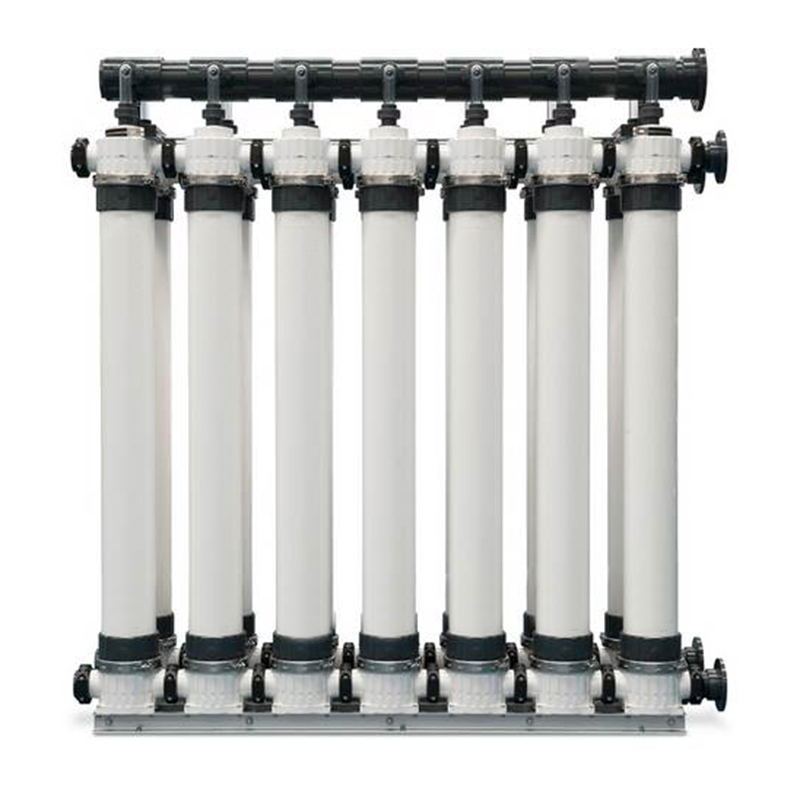
In the field of industrial water purification, strict quality standards are required. In response to this challenge, a membrane filter with a PVDF str...
See Details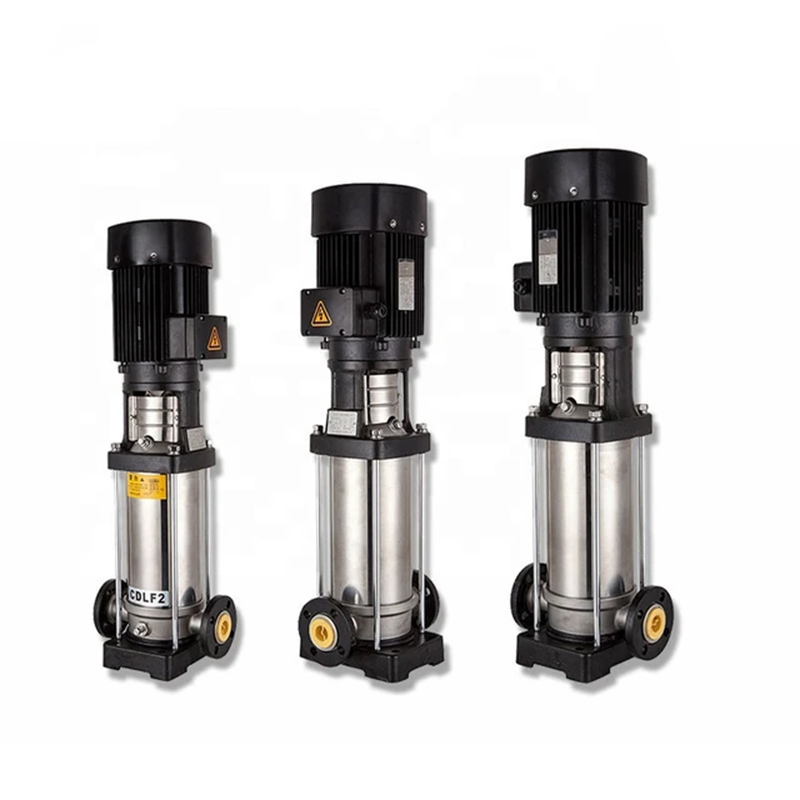
The CNP vertical multi-stage centrifugal booster water pump is an efficient and reliable industrial pump designed to meet various hydraulic booster ne...
See Details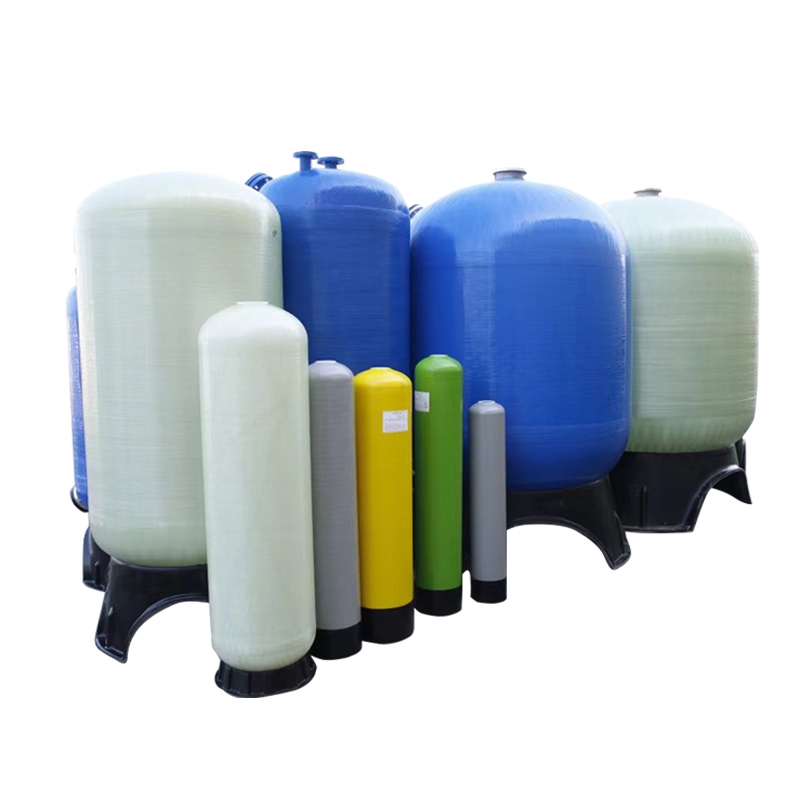
FRP filter tank is a filtering device that uses FRP as the shell material. It is widely used in water treatment, sewage treatment, industrial water tr...
See Details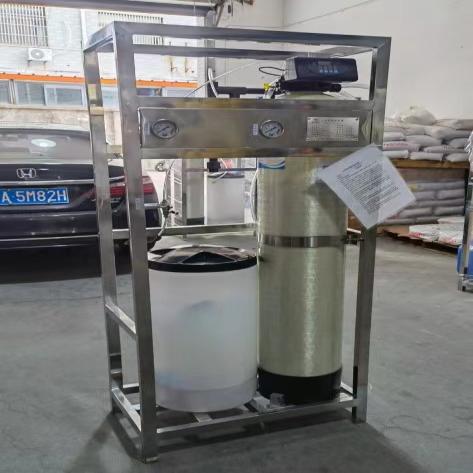
1 ton single tank is a device for storing and dosing water treatment chemicals, usually used in the dosing link of water treatment systems. The device...
See Details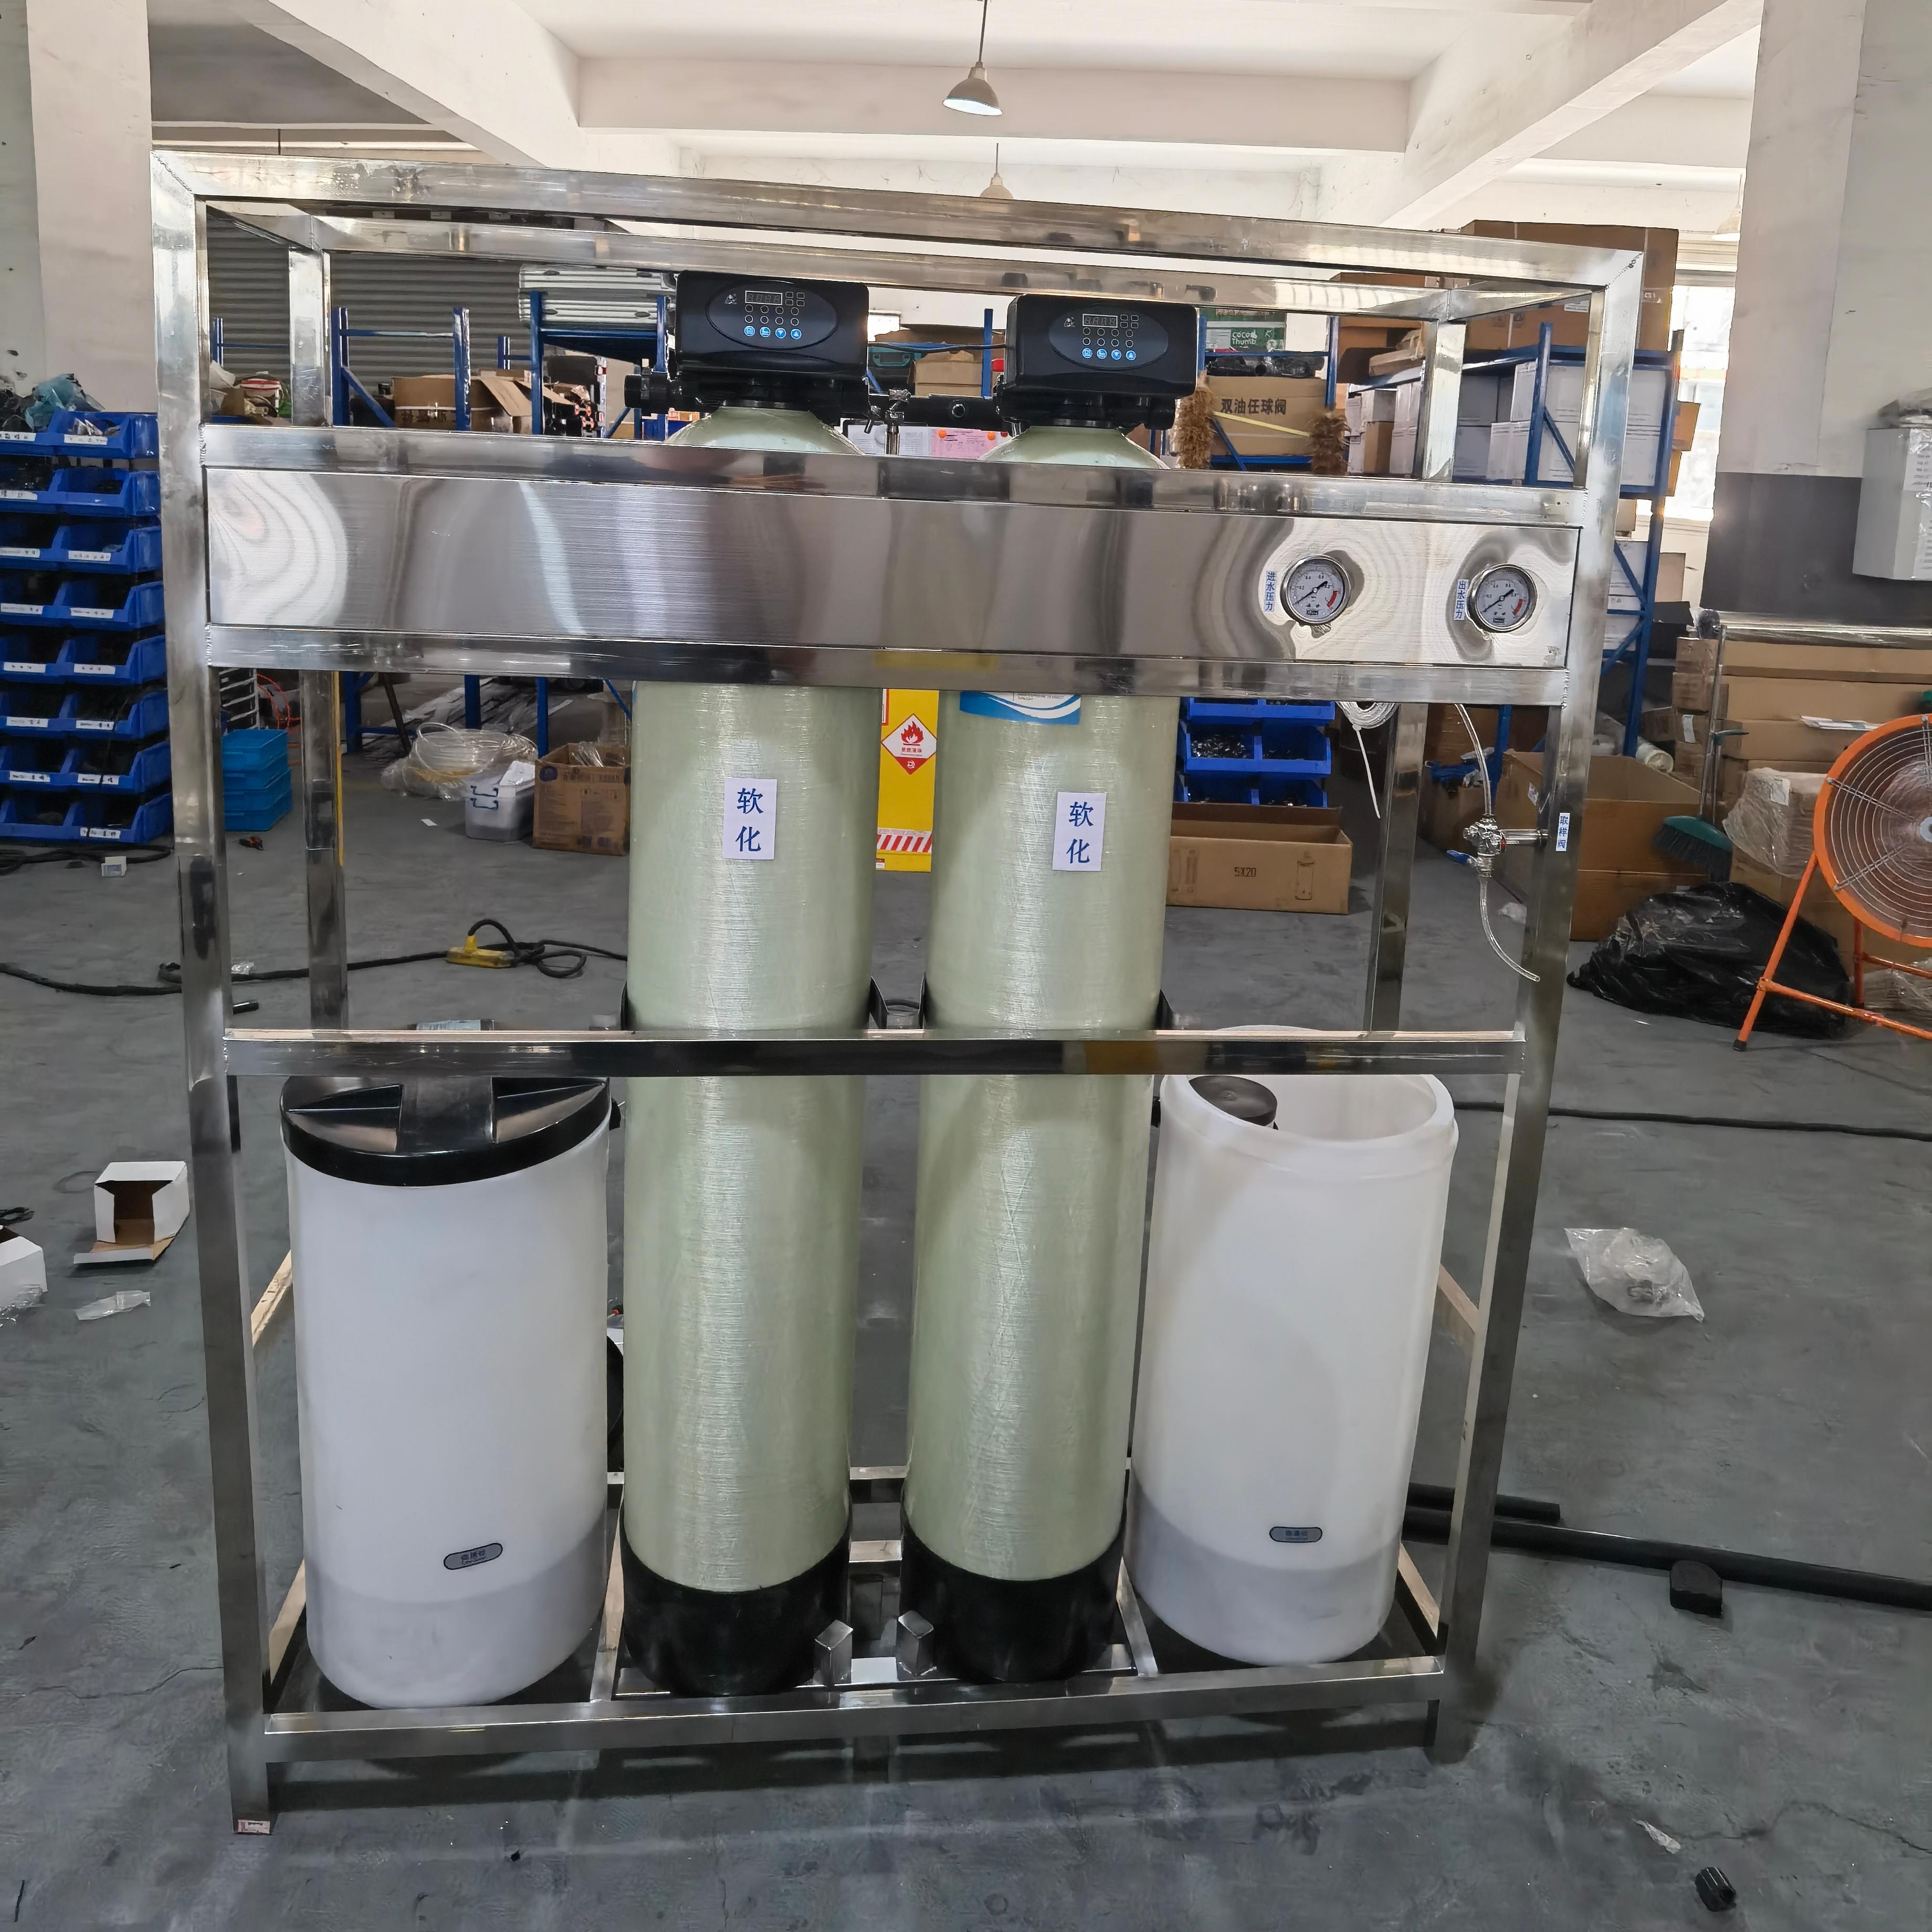
1 ton double valve double tank continuous water supply is an efficient and stable water treatment equipment, widely used in softened water, deminerali...
See Details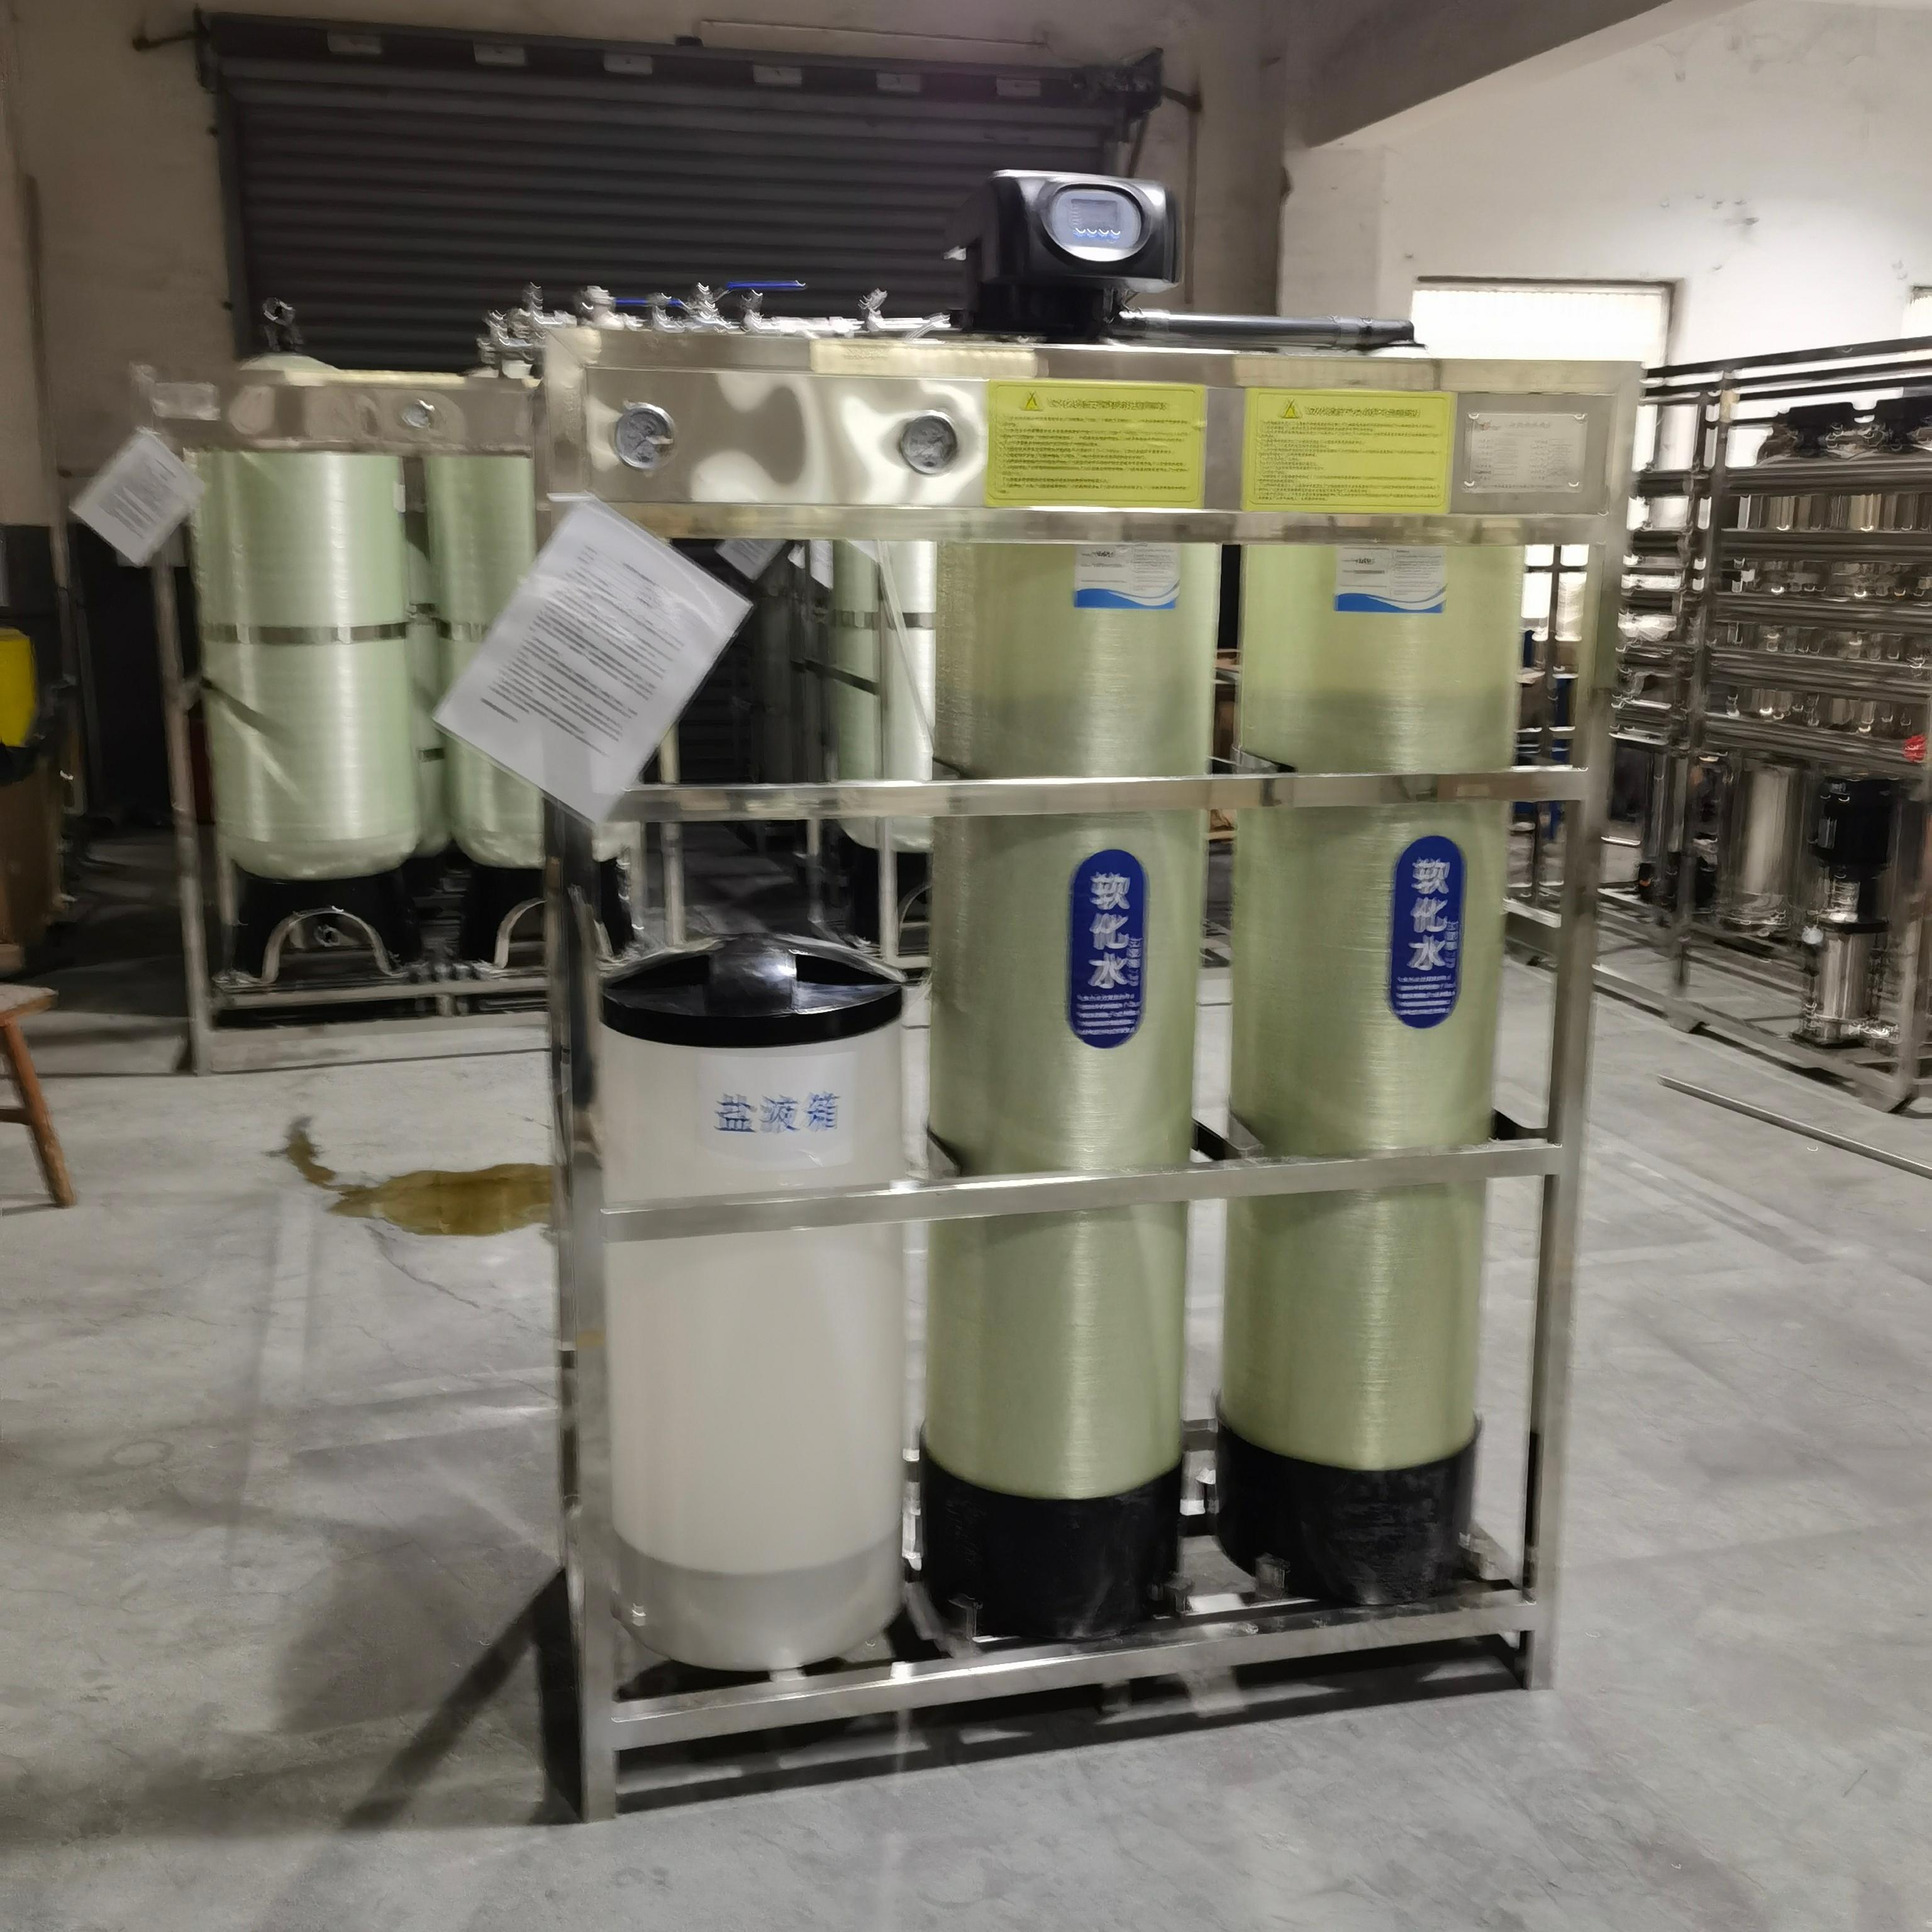
The 3 tons single valve double tank, one for use and one for standby is a high-efficiency water treatment equipment, which adopts a single valve doubl...
See Details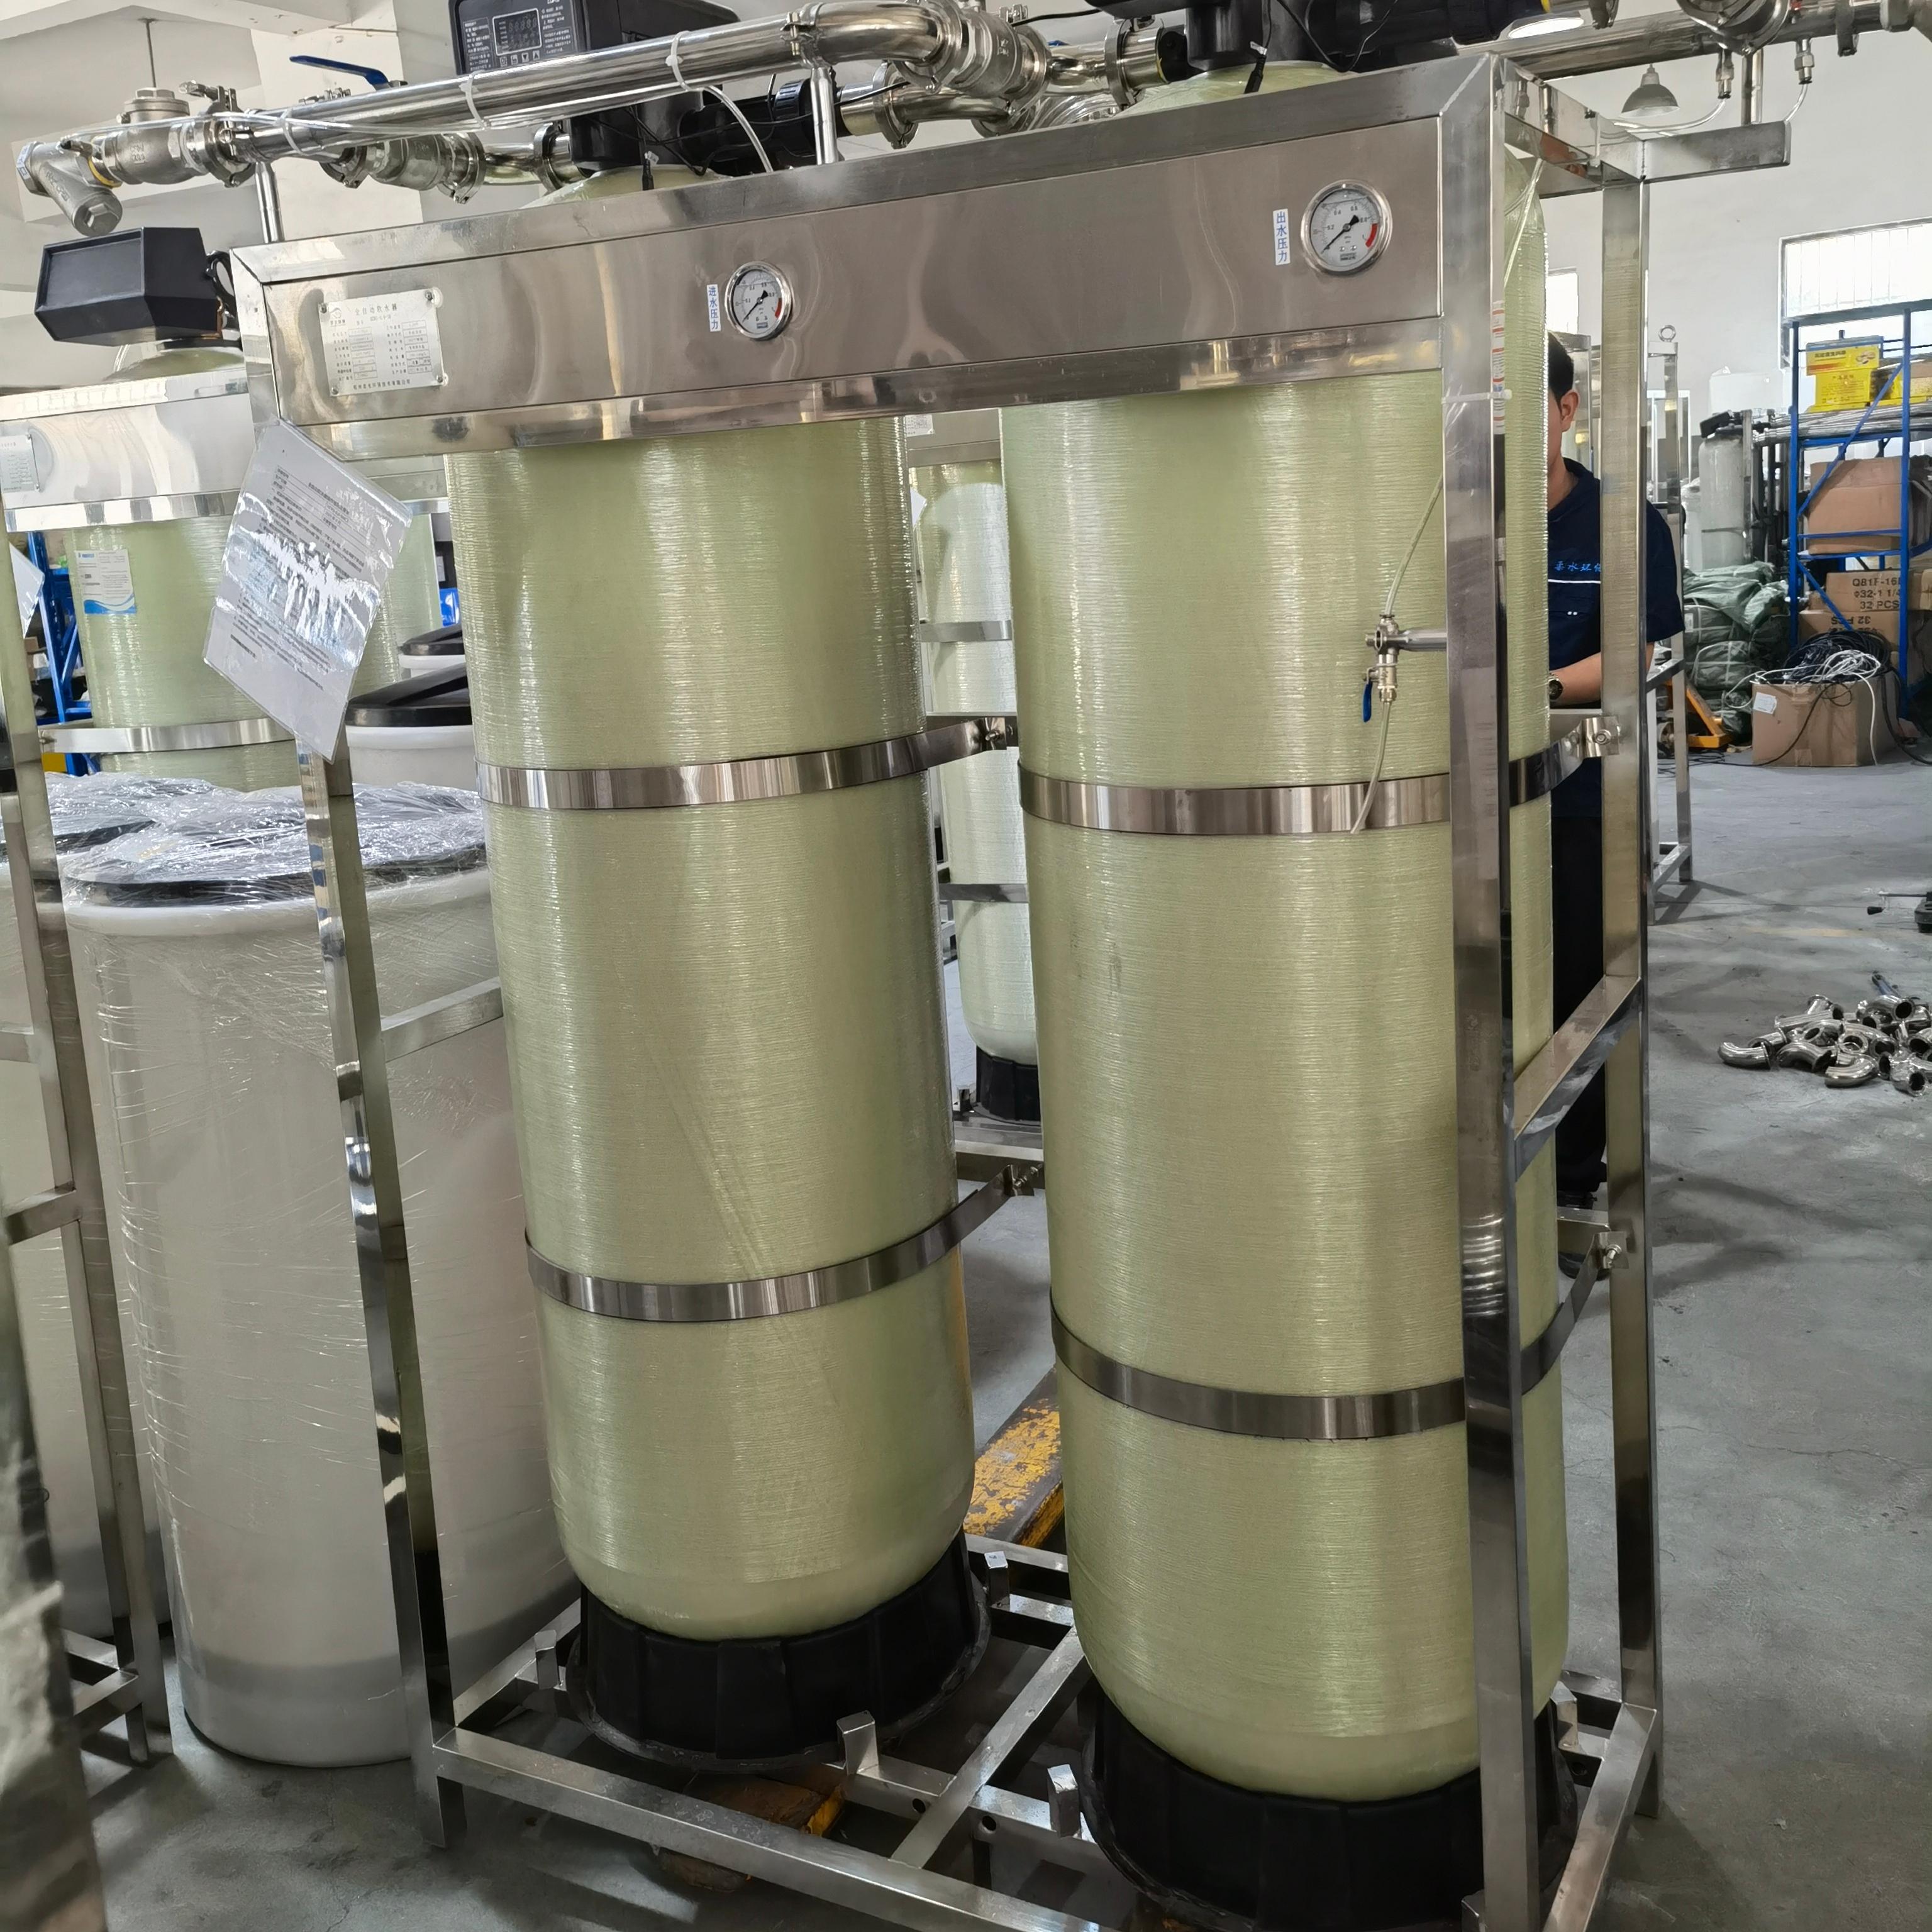
This 6-ton dual-valve dual-tank continuous water supply equipment is designed to provide efficient and stable water treatment solutions. Through the d...
See Details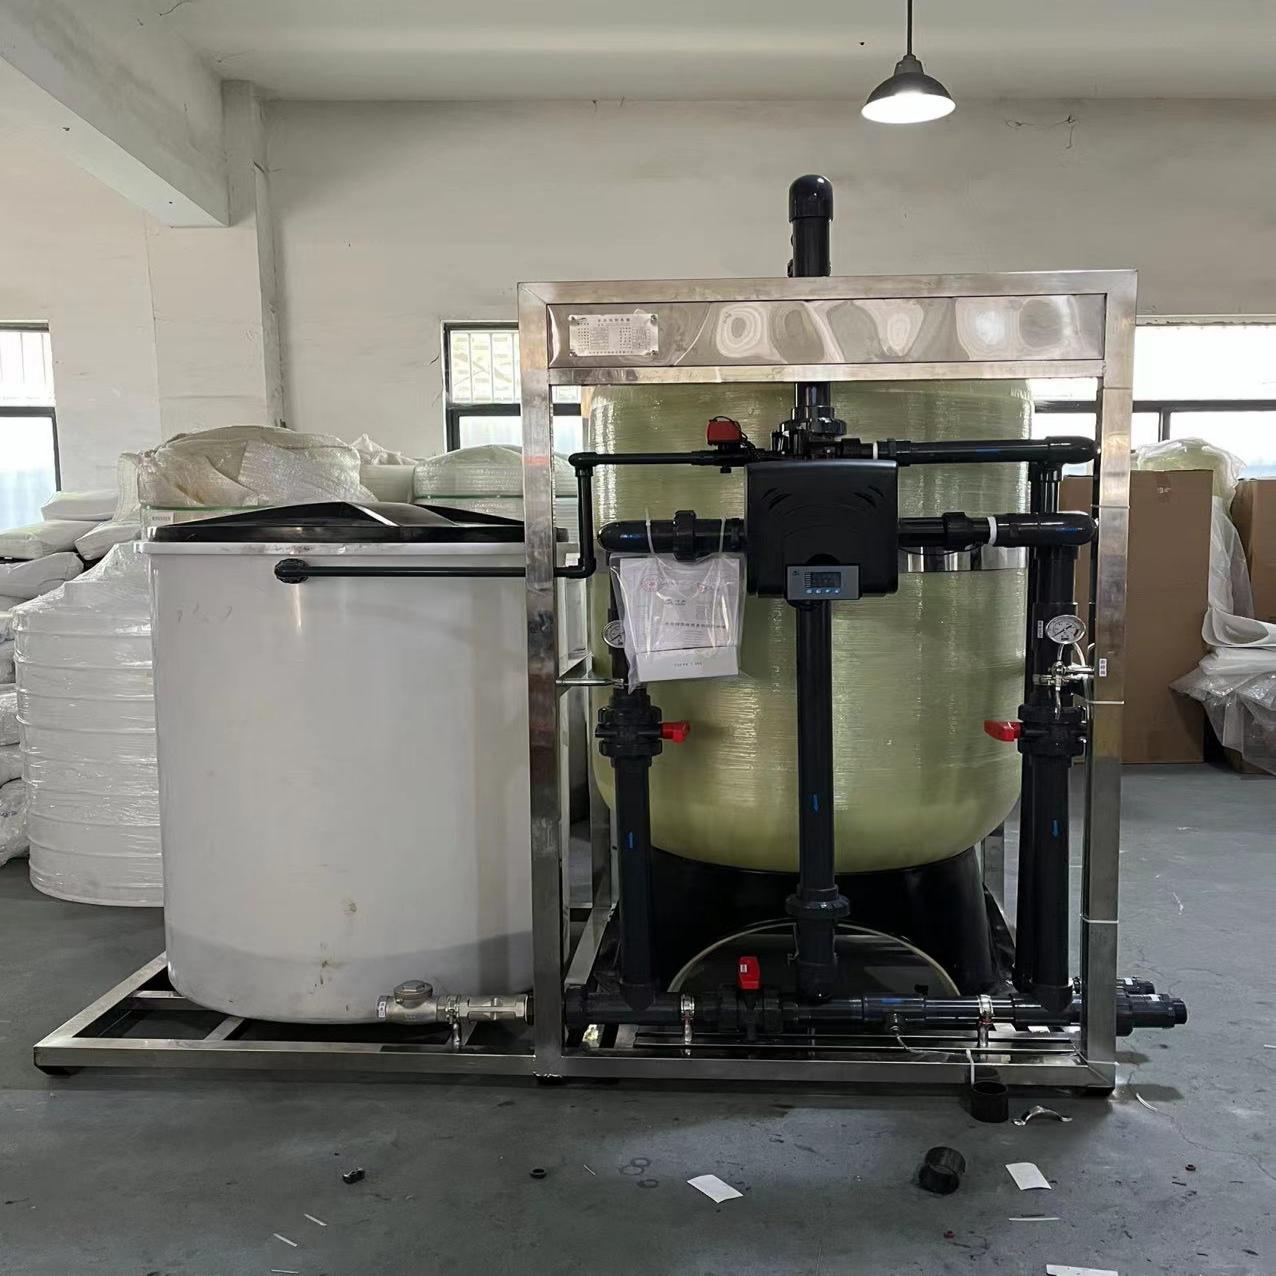
The 15-ton single valve single tank equipment is designed for large-scale water treatment needs and is suitable for places that require large-capacity...
See Details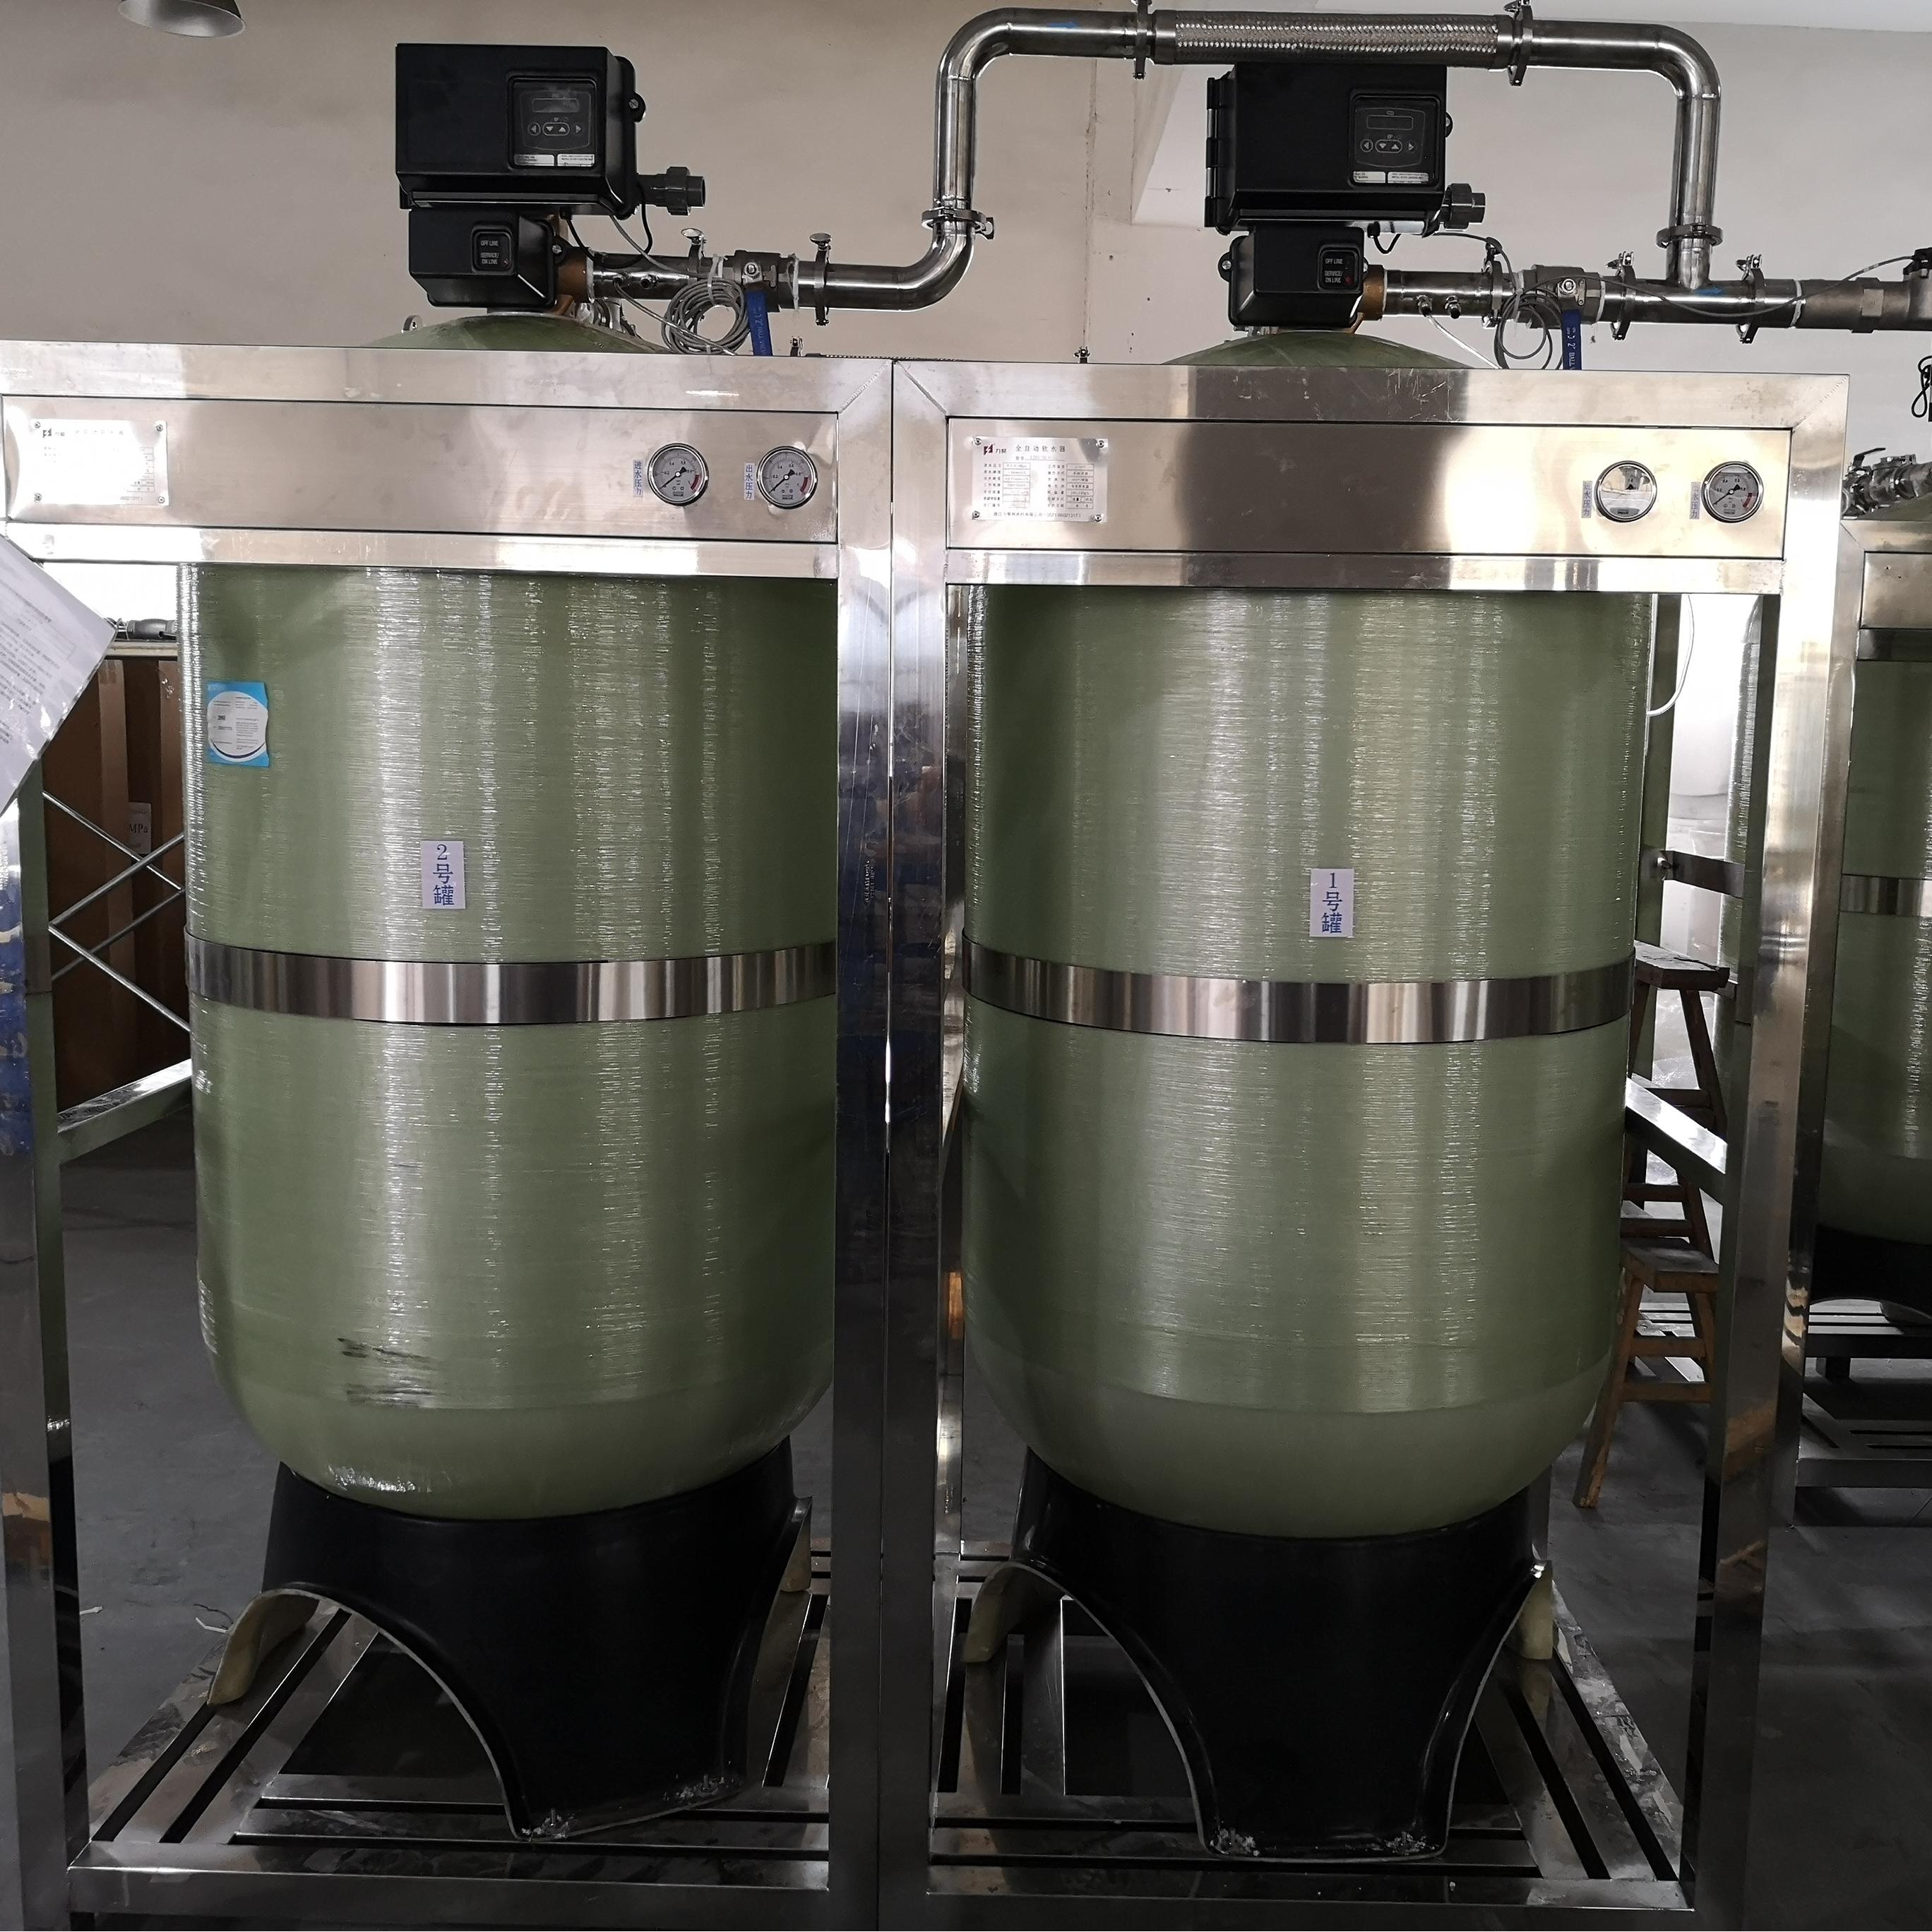
The 16-ton double valve double tank, one for use and one for standby water treatment system is a large-scale water treatment equipment equipped with t...
See Details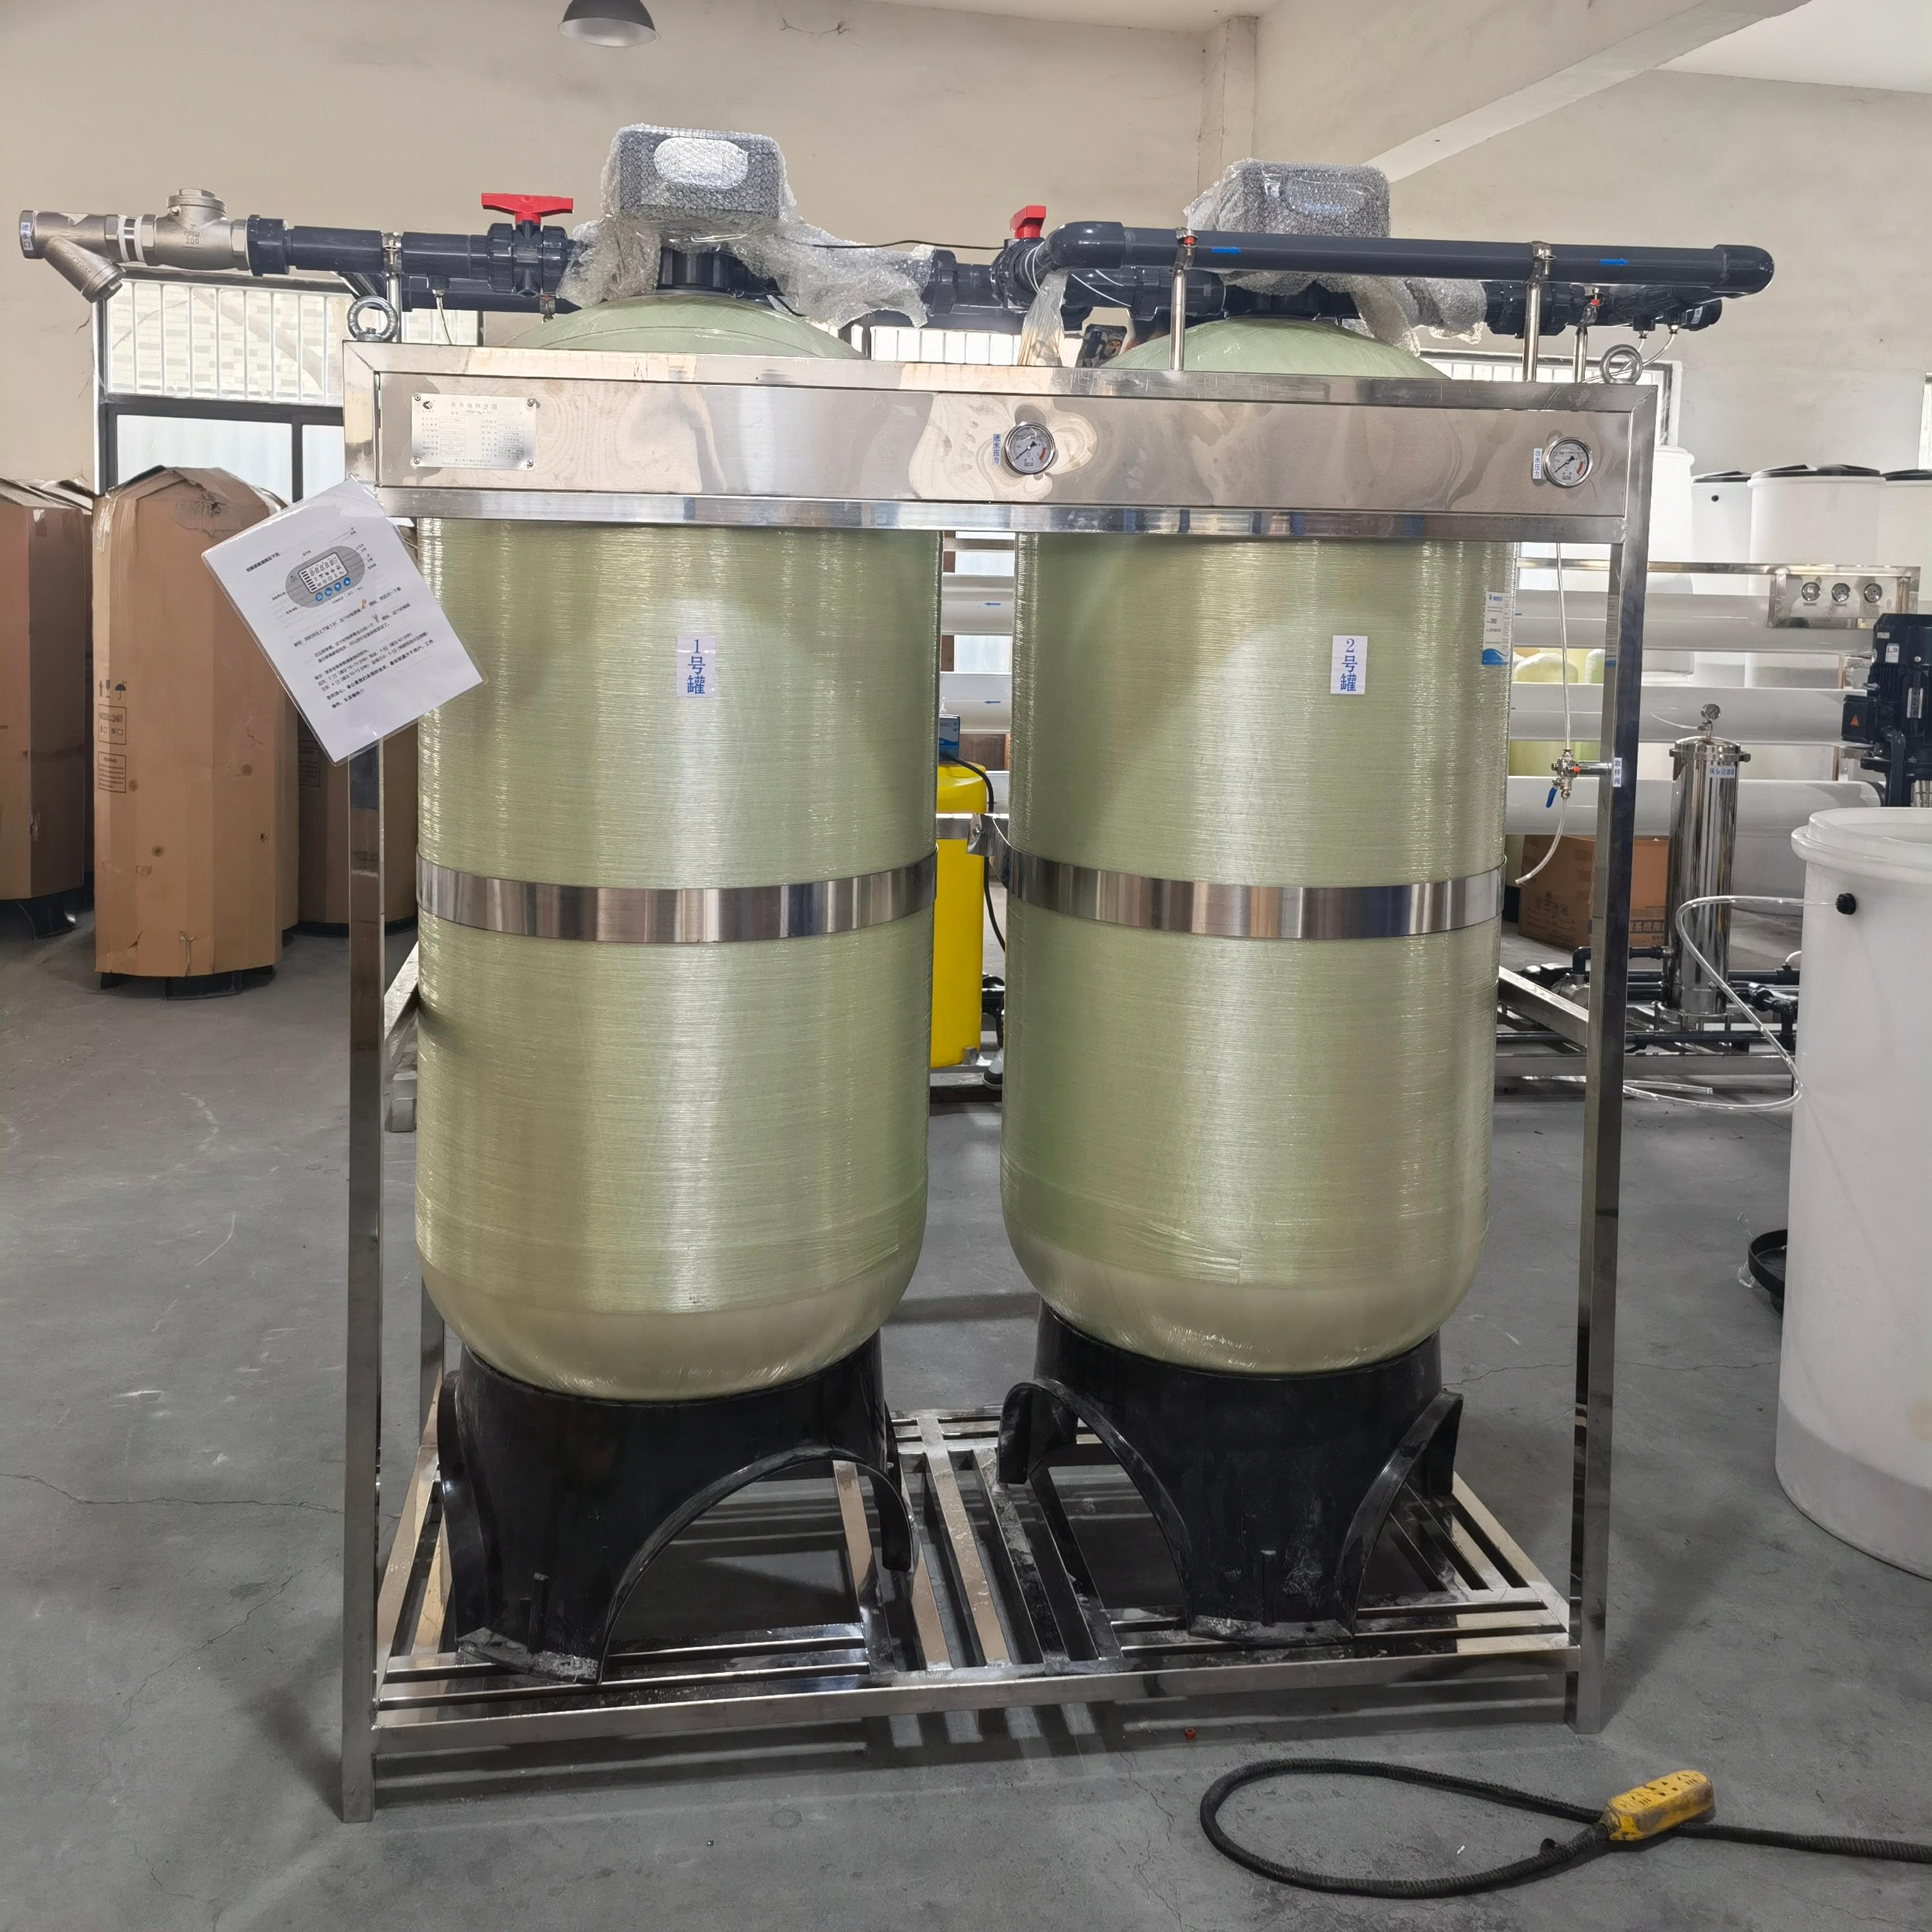
The 10-20 tons double valve double tank continuous water supply system is a high-efficiency equipment suitable for large-scale water treatment project...
See Details
+86-13396595772
[email protected]
[email protected]
[email protected]
[email protected]
Room 508, Xingyuncheng, No.15 Xingling Street, Xingqiao Street, Linping District, Hangzhou City, Zhejiang Province.
Copyright ©2024 Hangzhou Roushui Environmental Protection Technology Co., Ltd. All Rights Reserved. Custom Industrial Civil Water Treatment Purification Equipment Manufacturers
